Since 1900, 35 earthquakes worldwide have each killed at least 10,000 people. Of these, 26 were in the Alpine-Himalayan seismic belt – a broad “crumple zone” where the African, Arabian and Indian tectonic plates collide with Europe and Asia. Most of these deadly earthquakes were caused by the rupture of faults that had not previously been identified.
Tim Wright is Professor of Satellite Geodesy at the University of Leeds and Director of the Centre for the Observation and Modelling of Earthquakes, Volcanoes and Tectonics (COMET). His work has been at the forefront of developing the use of satellite radar for measuring tectonic and volcanic deformation.
Below is a lecture presented by Tim at the Geological Society talking about his work trying to understand the nature of seismic hazard within the Alpine-Himalayan region.
A megathrust fault could be lurking underneath Bangladesh, India and Myanmar, exposing one of the most densely populated regions in the world to the risk of a large earthquake, according to new research published in Nature Geoscience.
A new GPS study measuring tiny ground movements since 2003 in the south Asia region has found strong evidence suggesting that a large tectonic fault beneath Bangladesh and east India is seismically active.
The new active fault beneath Bangladesh. Image from original paper, Steckler et al. 2016
The team, consisting of scientists from the USA, Singapore and Bangladesh, calculate that the megathrust fault could be accumulating strain energy at rates of about 15 mm per year.
Importantly, the researchers believe that the fault is “stuck” and has been storing energy for more than 400 years without a major earthquake; since the Mughal conquest of Bengal and the establishment of Dhaka as the Bangladeshi capital in the 1600s.
An earthquake occurs when the stresses become large enough that it causes the fault to break and releases all the stored energy. The 400 years of energy accumulation at 15 mm per year could result in a devastating magnitude 9 earthquake, similar in size to the Japanese quake that destroyed huge sections of the country’s northeastern coast in 2011. Such an event would have enormous consequences for more than 140 million people living within 100km of the megathrust in Bangladesh and India.
Earthquake hazard and vulnerable populations in Bangladesh and India. Source: Steckler et al. 2016
The tectonic activity of south Asia is a consequence of the collision of the Indian subcontinent with Asia, a process that began nearly 50 million years ago and is still occurring today. This monumental collision resulted in the uplifting of Tibet and the formation of the Himalayan mountain range. Over millions of years these mountains have been slowly eroded and deposited their rich soils onto the Bangladeshi plains by a network of giant rivers. The thick sediments have made the Bangladeshi plains some of the most agriculturally productive in the world.
While the sediments can take up some of the energy along the newly proposed fault, they’re not especially stable, particularly around the rapidly developed eastern outskirts of Dhaka. If a major earthquake strikes, the sediments could even amplify the seismic waves, causing further destruction.
“Dhaka’s basically like building a city on a bowl of Jell-O [jelly],” says Steckler, lead author of the new study, implying that even small earthquake shaking could be amplified by the sediments.
The Savar building collapse in 2013, which resulted in over 1100 deaths, showed the world that building codes in Bangladesh are not strictly enforced. If buildings are collapsing on their own, it is a terrifying prospect to consider what would happen during an earthquake. The lack of preparedness is clear and it is essential for the Bangladeshi government to make long-term changes to promote greater seismic awareness and stricter enforcement of building codes.
Recently a video has been circulating of Paul Beckwith from the University of Ottawa explaining how the northern and southern polar jet streams linked briefly across the equator this week.
Climate scientist Dr Caroline Holmes, who specialises in atmospheric dynamics, provides her independent view on this event below:
————————————————————————–
The essence of this video is the claim that the northern and southern hemisphere jet streams have connected via air crossing the equator, for a brief period of time; that this is ‘unprecedented’; and that it heralds dangerous consequences. To give my thoughts, I’ll address some of the concepts that come up in the video and some issues of language or terminology that are crucial for understanding it, and try to give an answer on whether I think this is a worrying development or not.
1)What’s so special about the equator?
Crash course covering two aspects: one is thermal, i.e., its to do with heat. As we know, the equator receives more heat from the sun than the poles do. Therefore it’s warmer. The atmosphere ‘tries’ to redistribute this heat from the equator to the poles, which is the reason for a lot of the circulation (i.e. large-scale movement of air and water) that we see in the ocean and atmosphere. Note, that in the northern hemisphere (I’ll call it NH from now on!) summer, the maximum heat from the sun is actually felt slightly north of the equator, and in southern hemisphere (…SH…) summer, slightly to the south of the equator. So, actually the ‘heat redistribution’ in the atmosphere is really from about 10°N to both poles in NH summer (SH winter) and from 10°S to both poles in SH summer. The other special thing about the equator is to do with the fact that the earth is a rotating sphere. So every point on the earth’s surface is rotating, once a day, around an axis that runs from the north to south pole. At the equator, this rotation requires covering a lot more distance (a circle of bigger circumference) than it does near the poles. So as air moves away from the equator (and indeed anywhere) it’s subject to forces linked to this rotation. (I’ll stop there because that’s a whole ‘nother blog post!)
2)What is a jet stream? The term ‘jet stream’ typically refers to a tight (i.e. short north-south extent) band of very fast winds, high in the atmosphere. We usually use the wind speed at 250 hPa (i.e. the level in the atmosphere where pressure is 250 hPa; about 16 km, very roughly speaking) to describe it, although in some jet streams winds are fast near the Earth’s surface too. At the simple level, each hemisphere has one, or two, jet streams. One is on the edge of the tropics, and one is in mid-latitudes (broadly about 30-60°N). Sometimes, or indeed often, the two combine. The jet streams fundamentally exist because of the two things I already mentioned above; the rotation of the earth, and the fact that the atmosphere tries to distribute heat from equator to pole. In the time-average picture, they are nice and smooth, and largely west to east, although not entirely so, and in the NH especially they are not a continuous band around the world; they are split up by, in particular, the Rocky mountains and the Eurasia continent. As time varies, however, the jets have big waves in them; they break up; they shift from north to south; they pulse in strength. They are hugely variable.
3) Is the climate system normally ‘stable and predictable’ and now becoming ‘chaotic’?
The atmosphere certainly isn’t. One of the most fundamental things about the atmosphere is that it is a chaotic system. You’ve probably heard the ‘butterfly flapping its wings causes a hurricane around the world’ saying. It’s that. Or, less dramatically; tiny changes in the atmosphere in one place can push it into a different state from the one it was heading to. It’s why we can’t do weather forecasts perfectly; because without knowing the state (by which I mean its temperature, how much water it contains, how fast it is moving and in what direction) of every point in the atmosphere, perfectly, we can’t be sure we are on the right path. The climate system on the other hand is a much trickier issue. I’m not even sure what the video is trying to explain regarding this. There are aspects of the climate system that are certainly predictable (seasons, for example. And they aren’t going to be eroding in a hurry, because they rely on changes of the earth’s orbit around the sun and the angle of its axis, which happen slowly. I.e. 10s to 100s of thousands of years slowly.) The stability of the climate system is a genuine question. Imagine a ball on a slope.
If I shove it gently, it returns to where it was. This is a ‘stable’ condition. If I shove it hard, however, it might go over the ‘hill’ to the right; it will not return to where it was. This is what is meant by unstable. A related concept is ‘tipping points’; if it goes over that hill, it might end up in another ‘bowl’; but it has been tipped into another type of behaviour (in this case, a different area to roll around in).
4)What is climatology?
Climatology is a very broad field. It’s the study of climate. For example, it’s a term that could probably cover people who study the output from climate models about what will happen in the next century; look at observational data gathered over the past 100 years; examine tree rings to try and work out what has happened to climate over the last several millennia; use mathematical techniques to explore what will happen to earth’s climate, and so on. There are better, or more detailed description for all these jobs, but climatologist is not wrong. The key thing is that a professor of climatology need not be (and in fact, probably is not) an expert on atmospheric dynamics, i.e., the movements in the atmosphere and what causes them, which is what this is all about.
It’s a beautiful visualisation of atmospheric conditions. It’s always worth being aware that first, the data that went into this is not as gorgeous as the end product! You can toggle the ‘grid’ button to show a point at every location where there is real data from the forecast model; the rest is interpolation between these points. And second, our eyes aren’t that good at interpreting information like this (sorry!) and are naturally drawn to colour boundaries. So, it’s easy to over-interpret patches of a different colour as indicating something very different. Now, as for some specific questions from the video, I’ll first address the idea that the jet stream should get, and is getting, ‘wavier’ as the atmosphere gets warmer. This argument is still, as far as I know, really controversial. I discussed this issue extensively during my PhD. The theory relies on a chain of about five causal relationships (i.e., A causes B, B causes C, and so on) in a chaotic system. Some of these are fairly convincing and some are not. The data providing evidence of this use information from a fairly short time series (30 years, which for finding robust results about anything other than time-average is too short). The original paper can be found here: http://onlinelibrary.wiley.com/doi/10.1029/2012GL051000/full. However, later papers examining the claim across different datasets, and for various measures of ‘waviness’, don’t find strong evidence for such a pattern (e.g. http://onlinelibrary.wiley.com/…/10…/grl.50880/abstract). Therefore, citing it as fact is very misleading. The second question is whether something remarkable just happened, and whether it can be described as ‘the jet crossing the equator’. Flow crossing the equator is not surprising; as I’ve mentioned above, the atmospheric flow is very variable. A colleague at Monash University kindly quickly checked a month of reanalysis data (essentially, this blends observations- from the surface, satellites, and upper air measurements from weather balloons- with the best available weather forecast models, to produce a historical ‘best guess’ of what the atmosphere has looked like over recent decades). She found that the wind speeds with flow across the equator of the speed seen here (about 20 metres per second) aren’t that rare. So as above; flow across the equator isn’t astonishing. Can this be described as the jet crossing the equator? Tricky; not all fast upper level winds are jet streams, and in addition the jet streams are generally a lot faster than this (about 100 metres per second). So then, is this behaviour where there appears to be some linkage between the NH and SH jet surprising (even ‘unprecedented’)? Unfortunately I can’t answer that right now! Links like this are easy to see by eye, but harder to define when you look for it in real data, so it wouldn’t be a totally trivial job to find out. However, I think that there is no reason why it would be surprising; given that the jets move around, and airflow crosses the equator. For the same reason I don’t think it’s a particularly meaningful event. Finally, it’s worth saying, the jet streams have been exhibiting weird behaviour recently. The winter of 2013/14 was really remarkable in the NH, for example, and the UK met office produced a great report about the storms and floods that occurred in the UK as a result as well as what was happening in Canada at the time. So I think it’s important to understand what the jets are doing, and why, and whether it’s new. The changing temperature of our atmosphere due to climate change is hugely worrying, and how this might impact the jet streams, particularly in the northern hemisphere, is still poorly understood. However, in conclusion, I don’t think this particular instance is panic worthy.
————————————————————————– Dr Caroline Holmes gained her PhD in climate science from the University of Reading, where her thesis investigated the effects of Arctic change (warming and sea ice loss) on mid-latitude climate, in particular the jet streams. She now works on understanding the impacts of climate change in Scotland at the University of Edinburgh.
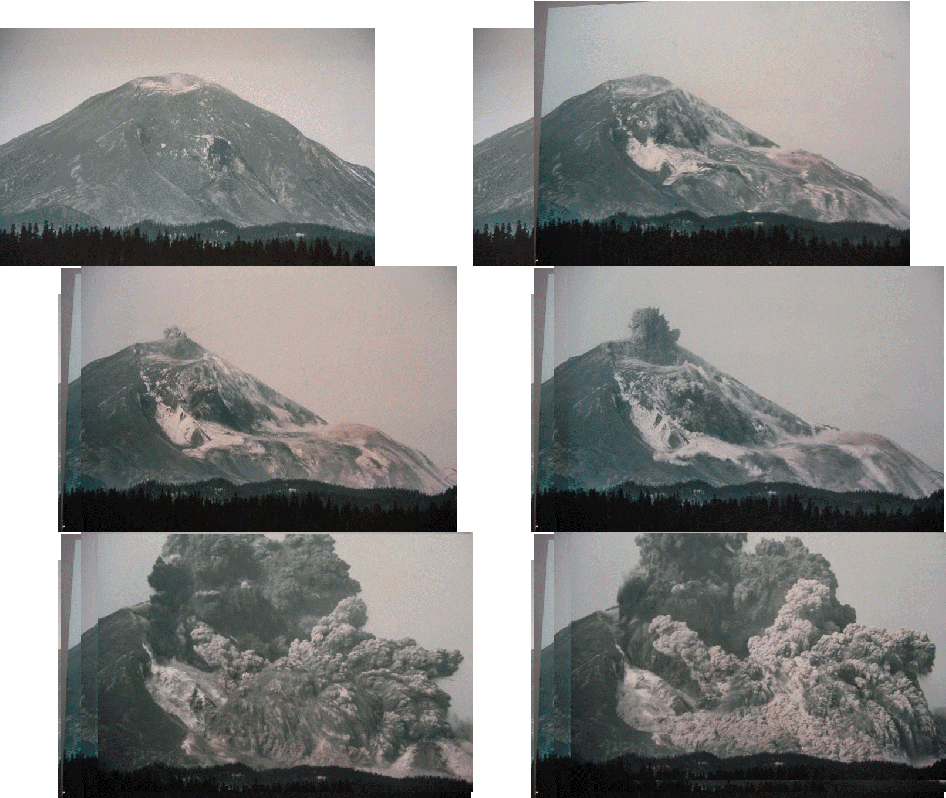
Today is the 36th anniversary of the historic eruption of Mount St. Helens in Washington State, USA.
The May 18, 1980 eruption was a rare type of volcanic eruption known as a lateral blast. Most explosive volcanoes throw material upwards in an eruption; in the case of Mt. St. Helens the eruption occurred horizontally, releasing pent-up pressure inside the volcano. The eruption obliterated the entire north side of the volcano and resulted in the largest debris avalanche in recorded history.
An incredible series of images showing the explosive flank collapse in the eruption. Source: USGS
The 1980 Mt. St. Helens eruption played an extremely important role in improving our understanding of volcanic eruptions and the magma plumbing system beneath volcanoes. It was the first time pyroclastic flows – clouds of super hot gas, ash and rock that move at hundreds of miles per hour – were studied using modern scientific techniques. Even now, 36 years later, scientists are still publishing new and interesting insights gleamed from the 1980 and later eruptions.
The new central cone inside the older crater. Source: USGS
The volcano is still very much alive today. In recent decades a new volcanic cone has developed in the central crater. Thankfully, scientists from the United States Geological Survey (USGS) are keeping a close eye on the volcano and will hopefully provide warning if a new eruption is imminent.
See how Earth’s 1000+ active volcanoes were formed in this great national Geographic video.
How are radar satellites revolutionising our understanding of Earth processes and allowing us to respond to extreme weather events and natural disasters?
Unabated greenhouse gas emissions could lead to sea level rise twice as high as we had anticipated, according to a recent study published in Nature.
By the end of this century, scientists predict that sea levels could rise by over 2 meters on average. Note that this is a global average, meaning that some areas could see much higher local rises in sea level. For Small Island Developing States, this could mean the end of their existence altogether. The research has been welcomed by the scientific community, who had already raised reservations with regards to what was called “very conservative” estimates of sea level rise caused by a changing climate.
So what has changed, how could we suddenly double sea level rise? The answer lies in complex processes involved in the melting of ice in Antarctica. Previous estimates had failed to take into account accelerated melting caused by disintegrating ice sheets. In fact, scientists had only been able to consider the melting ice shelves due to increased air and water temperatures, and had ignored the impact of surface melt-water and rainfall which can help fracture large chunks of ice.
The Thwaites glacier is one of the fastest flowing glaciers off Antarctica. Source: Jim Yungel/NASA
Climate change adaptation has been hailed as the ultimate recourse to prevent negative impacts of sea level rise. For instance, in a number of coastal regions, ecosystem-based adaptation helped by mangroves has been underway for some years already. Mangroves play a significant role in protecting coastal regions from intense storms including typhoons, expected to increase in frequency with climate change. Combined with sea level rise, such storm could be catastrophic, especially in densely populated areas.
Mangrove forests like these help protect coastal communities against storms and storm surges.
In previous adaptation planning, the unique property of mangroves to “grow soil” had been counted on to mitigate the impacts of rising sea levels. The rate of growth of mangroves was very much in line with previous climate change projections, yet this new data would suggest that these fragile ecosystems would no longer be able to keep up with the increased rate of sea level rise. Hence, millions of the most vulnerable coastal communities will likely have to rethink their adaptation strategies, a very costly endeavour.
So what is the silver lining? If we achieve the targets set in the 2015 Paris Agreement, sea levels will continue to rise, but never to the rate which would occur if Antarctica’s melting was to start accelerating. Coastal communities will still need to adapt, but costs will be reduced and lives will be saved.
An earthquake of magnitude 7.8 occurred in Ecuador on the 16th April this year. With the current death toll at 654 and another 58 still missing, this is one of the most devastating disasters South America has seen in modern times. Although the earthquake epicentre was in a relatively sparsely populated area, according to the US Geological Survey the focus was shallow at 19.2km (12 miles) and located 27km (17 miles) from Muisne off the west coast of northern Ecuador, meaning the effects were stronger than expected upon the Earth’s surface.
Ground shaking from the magnitude 7.8 Ecuador earthquake. Source: USGS
The main initiator of earthquakes is tectonic plate movement. This particular earthquake was caused by a shallow thrust fault on or near the boundary between the Nazca and South American tectonic plates (USGS, 2016). In real terms, this means the Nazca plate is sliding beneath the South American plate, and the build-up of energy due to friction is realised in one sudden slip, causing the earthquake and its aftershocks (Wald, 2009). Similar systems have caused some of the strongest earthquakes in the world, including the 1960 Chile earthquake of magnitude 9.5 – the largest ever recorded. Due to the presence of the subduction zone, this particular area within Ecuador is known to be prone to earthquakes, with many of the quakes occurring at 0-70km depths beneath the Earth’s surface. This often causes the consequences to be more devastating. The subduction system is also responsible for the formation of the Andes, the longest mountain chain in the world, and the high levels of volcanism within the area (USGS, 2016).
Scientists have been speculating as to whether the 2016 Ecuador earthquake was linked to the magnitude 7.0 Japan earthquake that occurred the day before, on the 15th April, with a shallow focus at 10km depth (Byrd, 2016). The idea behind this is something known as ‘remote triggering’, whereby a magnitude 6.5 earthquake in Japan would have caused slip along the boundaries of the tectonic plates on the other side of the Pacific Ocean, which triggered the tremors that made up the earthquake (Brown, 2016). However, this may also be chance due to both localities being situated on the Ring of Fire, an area known to be extremely tectonically active. Research so far shows no evidence for remotely triggered earthquakes to reach magnitudes above 5, making this particular situation between Ecuador and Japan either the first recorded case of its kind, or a coincidence. However, there has not yet been enough time for thorough research, but many earth scientists will now be focusing on the possibilities of using this information to help us to forecast and prepare for earthquakes in the future.
Camilla is a 3rd year undergraduate student in the School of Earth and Environment at the University of Leeds. She likes to combine her passion for travel with her love of geology. Check out her blog at: www.geologyandme.weebly.com




 Camilla is a 3rd year undergraduate student in the School of Earth and Environment at the University of Leeds. She likes to combine her passion for travel with her love of geology. Check out her blog at: